
Google PageSpeed Insights and GTmetrix are both great tools to help identify speed-related issues and fix them. Both have their advantages and disadvantages and, in my opinion, one is ultimately a better tool than the other. Note that these are just my opinions, you should make your own opinion and utilize what works best for you. Also, keep in mind that there are so many different variables that go into the results in both tools and every website is different.
My personal opinion is that GTmetrix offers better information to see exactly why your website is slow and shows “Real World Numbers”.
Why?
Real-World Numbers
What do I mean by this? A real-world number to me is something that you can use to understand how your page loads. Getting a generic numerical grade of 1-100 doesn’t offer much insight. Google offers the 1-100 grade for both mobile and desktop and offers solutions on possible fixes.
Your website scored 75 out of 100. What exactly does that mean?
With Google, you really don’t know. GTmetrix offers the same 1-100 score, one from Google and one from Yslow, so you get two different grades from two different sources. Those still aren’t what I would consider real-world numbers though. GTmetrix page speed provides three pieces of information that I believe everyone should focus on and are what I consider “Real World Numbers”.
- Fully Loaded Time
- Total Page Size
- Requests

Fully Loaded Time
This is the time it takes to fully load your website, all the images, and all the resources. This number is significant because at the end of the day this provides the answer to your question about coming to these websites. Is your website slow? Well, this provides the “speed”.
This metric should be focused on more than an arbitrary 1-100 number. I’ve seen websites with poor 1-100 grades have fast load times and I’ve seen websites with great 1-100 numbers have slow load times. This is why focusing on the time in seconds is infinitely more helpful than a grade.
Total Page Size
This is the total size of your page after it’s fully loaded. If you have a 200-megabyte image on your website, this will be calculated into the total size of your website. It factors in everything from images, stylesheets, scripts, and even external resources such as your Google Analytics tracking script. It will show the value in megabytes, which can be beneficial in understanding how much data mobile users have to use to access your website.
Requests
This is the total number of requests your website requires to load. One request can be one image or one script. If this number is at 20, that means to fully load your website your browser was required to download 20 items, and the size of those 20 items will total up to your total page size.
What do these metrics mean to me?
The good thing about GTmetrix is that they show if you are above average, below average, or within +/- 5% of the average. These are indicated with a green arrow, a red arrow, and an orange diamond. (see below).
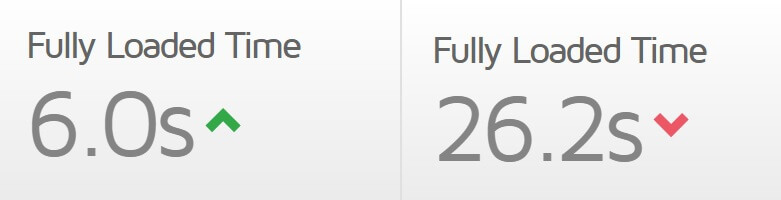
These numbers are still up to your interpretation. According to GTmetrix, a 6-second load time and a 2MB website are above average. If through analytics you know your user base is mostly mobile users, this could be a big problem and could increase your bounce rate. This is where the information provided shouldn’t be taken as is and should be applied to your website’s specific needs. If you know through analytics that your user base is entirely desktop users in a city with multiple high-speed internet options, these numbers aren’t nearly as detrimental. That doesn’t mean they shouldn’t be improved. I have a personal goal to make websites under 1MB, and I personally wouldn’t be happy with a 6-second load time.
What can you do to improve these metrics?
Follow the recommendations from both Google and GTmetrix and you can see the numbers drop, in a good way. There are far too many different approaches to their suggestions for me to list them all but as an example; to enable caching, which is a big factor in page speed, you could do it through your hosting server or use a WordPress plugin. Even then, the way you do it through your server could depend upon what type of server you are using. GTmetrix does a good job of explaining how to execute their recommendations and if all else fails the answer is ALWAYS on Google.
These tools shouldn’t be a clutch though. Start with the speed in mind before you build your website. Minify your javascript and CSS. Make sure you’re compiling it into one file. Optimize your images before uploading. Most of these tasks can be automated using Gulp.js which will save you a ton of time and help you optimize your website.
Conclusion
The truth is I completely stopped using Google PageSpeed Insights. GTmetrix page speed offers results from Google, Yslow, and offers multiple other metrics, including waterfall graphs, etc. Google offers part of the picture but, in my opinion, doesn’t do a good job of explaining how they calculate their 1-100 grade. Did you know they will mark you down for using their own scripts?
They suggest enabling browser caching for their scripts, which is not possible for external scripts. There are ways to get around this, like hosting the script yourself but it’s not something Google helps with and is not something an average user would know about. Take a look at the screenshot of them marking down for using their google analytics tracking script:
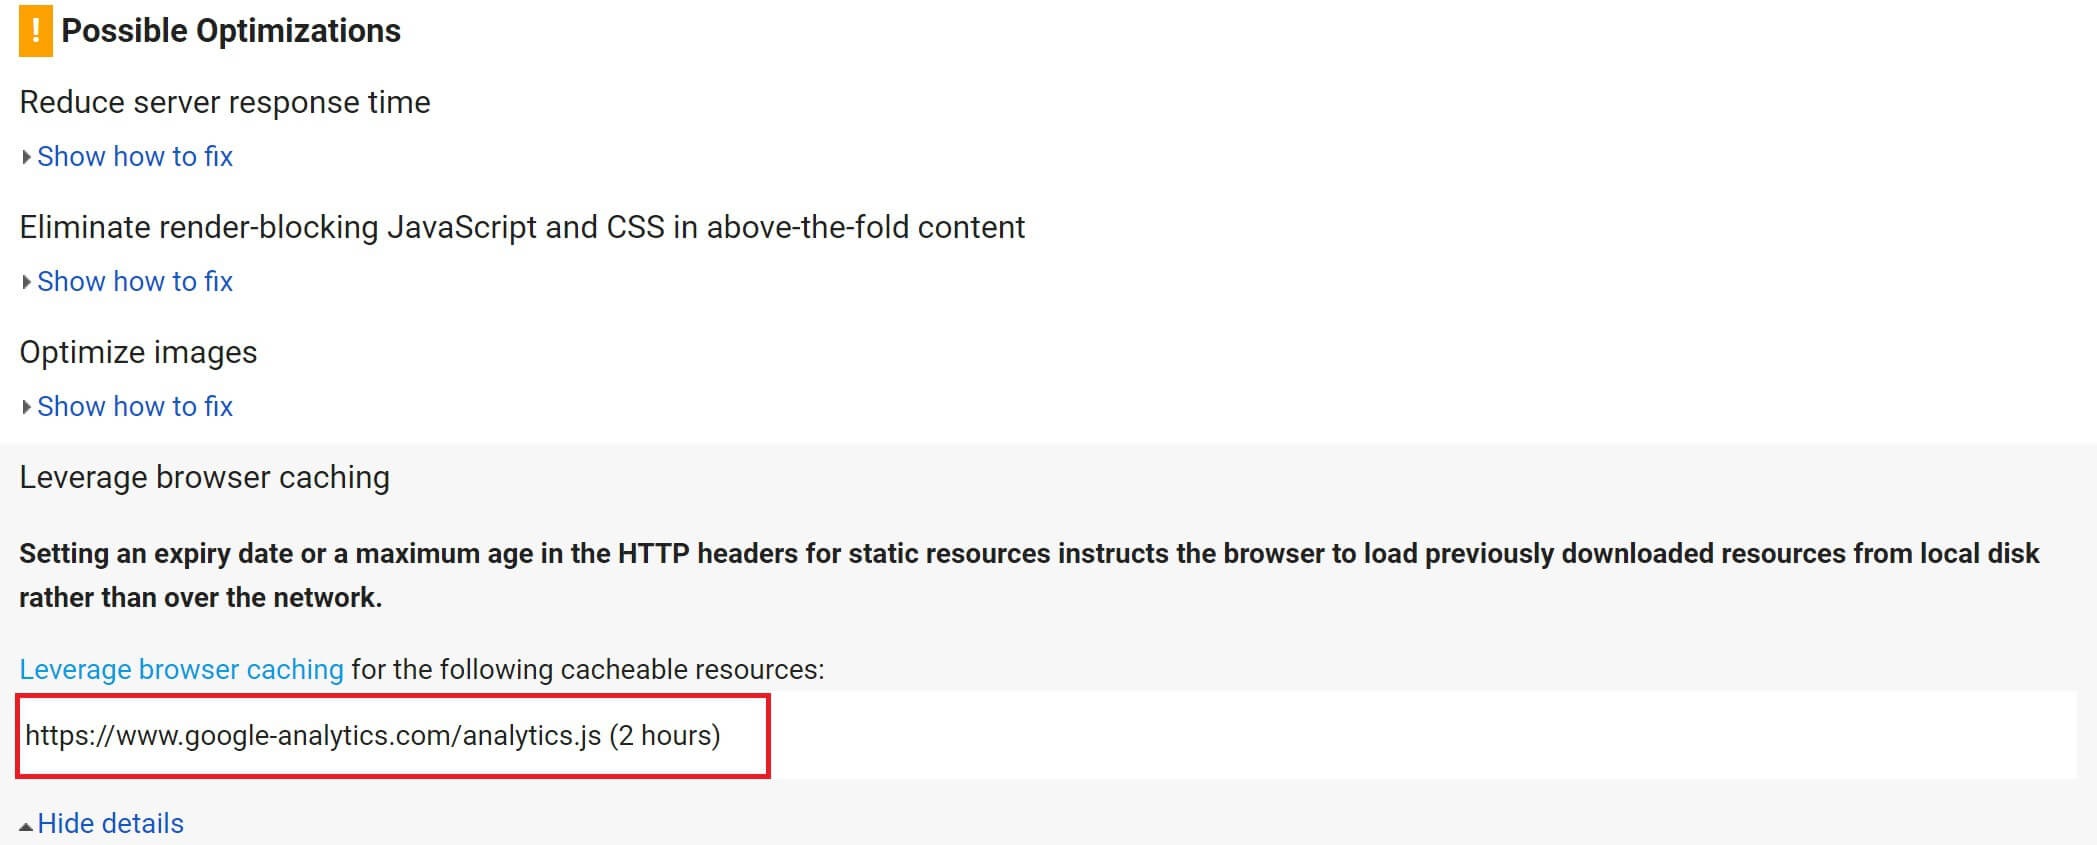
Reasons like this are why I focus on Fully Loaded Time, Total Page Size, and Requests. To me, they are numbers you can quantify and get a real idea of how your website is performing.
Related Posts

Top 10 Reasons Why Your Home Services Website Isn’t Cutting It
In 2026, homeowners don’t flip through the Yellow Pages or ask around the neighborhood before hiring a plumber,...
Read More
Best Ecommerce Platform for SEO in 2026: Shopify, WooCommerce, and WordPress Compared
Choosing the best ecommerce platform for SEO in 2026 is not just about picking the most popular option....
Read More
Marketing Attribution for High-Intent Leads in 2026: How to Track Calls, Forms, and Offline Sales Without Broken Data
If your company depends on quote requests, consultation calls, demo forms, booked meetings, or sales conversations that happen...
Read MoreOur Awards