
Knowing how to measure your performance is a game-changer when it comes to SEO. SEO – or Search Engine Optimization – is ultimately a barometer of how discoverable your site is online. Google, the grandmaster of online visibility, has gifted us with the switch to Google Analytics 4 from Universal Analytics. This free platform is a treasure chest of tools for evaluating your website’s performance. But remember, this data only becomes valuable when you know how to interpret it and take action.
Personalizing Your Analytics Settings
There’s no ‘one size fits all’ when it comes to digital analytics. The time zone and currency settings in Google Analytics should mirror your business’s core operational environment. Having your analytics reflect your business hours and currency will align the data with your actual sales and traffic patterns. Go to “Admin” in GA4, click “Property Settings,” and you’ll find options to adjust your time zone and currency there. Now, you’re dealing with a data reflection of your real-world business!
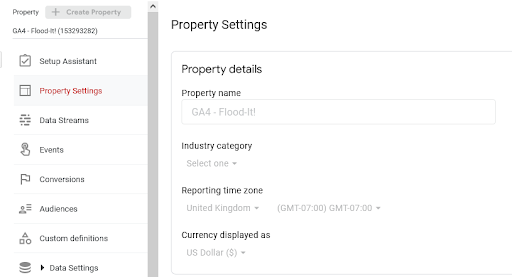 Personalize your settings: Customize your time zone and currency to align with your business’s operations
Assessing Traffic Volume
Your website’s lifeblood is its traffic – particularly the organic kind. In the Google Analytics 4 era, accessing this crucial data has become more intuitive. Head to the “Acquisition” tab and click “User Acquisition.” Here, you’ll see a complete breakdown of your traffic sources, including a dedicated section for organic search. You can assess the quantity of your organic traffic and quality by examining new users, sessions, and engagement metrics.
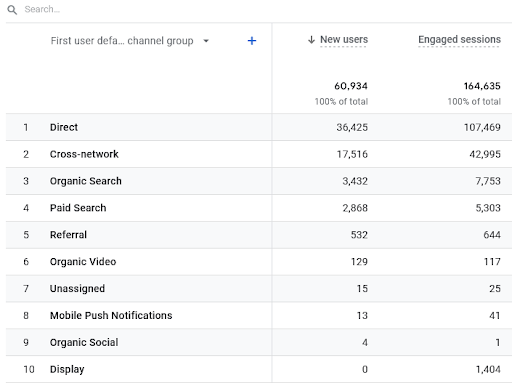
- Organic traffic insights: With the introduction of more granular traffic source breakdowns, Google Analytics 4 allows businesses to trace the origin of every site visit.
Analyzing Visitor Activity
In the fast-paced digital environment of 2023, understanding what captures your visitors’ attention is crucial. GA4 offers many features, including an event-based model which gives you rich insights into user interactions. One such important event is the “page_view” event, signaling when a user views a page on your website.
Here is how to uncover this crucial data:
- Navigate to the “Engagement” section: Begin by heading to the “Engagement” section on the left-hand menu of your GA4 dashboard. This section holds a treasure trove of data on how users interact with your website.
- Open “Events”: Inside the “Engagement” section, you’ll find “Events.” Click on it to open a comprehensive list of all recorded user actions on your site.
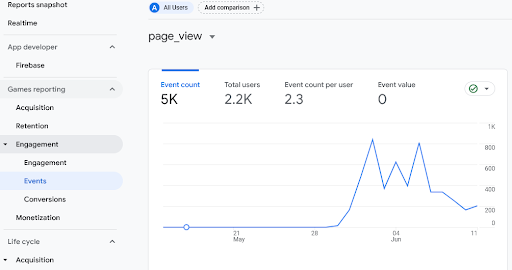
- Look for the “page_view” event: In the list of events, locate “page_view.” This event corresponds to instances where a user has viewed a page on your website.
- Explore the detailed “page_view” report: Clicking on “page_view” takes you to a detailed report. Here, you can see critical data like the total count of the event, the number of engaged sessions it led to, and the number of users involved.
- Break down data by Page title or Page path: To drill down into the performance of individual pages, you can add a breakdown by either “Page title” or “Page path,” based on your preference, which will show you the “page_view” event metrics for each page.
- Page popularity: This offers an unrivaled view of individual page performance. It provides a wealth of engagement data per page, enabling businesses to identify visitor trends and preferences.
First impressions indeed count in the digital realm. Your landing pages often serve as the first visitor interaction with your site. In Google Analytics 4, accessing this information requires a slightly different approach compared to previous versions. Here’s how to do it:
- Navigate to the ‘Engagement’ section: Start by clicking the ‘Engagement’ tab on the left-hand menu of your GA4 dashboard. This section provides valuable information about how users interact with your website.
- Open ‘Events’: Within the ‘Engagement’ section, you’ll find ‘Events’. Click on this to open a list of all user actions recorded on your website.
- Find the ‘first_visit’ event: Look for the ‘first_visit’ event in the list. This event indicates the first time a user visited your site during a specific time frame.
- View the detailed ‘first_visit’ report: You’ll get a detailed report by clicking on the ‘first_visit’ event. It shows the total number of first visits, the number of engagement sessions, and the number of users.
- Break down the data by ‘Page path’ or ‘Page title’: If you want to dig deeper into how individual landing pages are performing, you can add a breakdown by either ‘Page title’ or ‘Page path,’ which will show you the ‘first_visit’ event metrics for each landing page.
Using this approach, you’ll gain insights into how your landing pages attract new users, allowing you to identify which landing pages are the most effective and which ones may require optimization to provide a better first impression to your users.
Setting Up Conversion Tracking
Conversions are critical actions you want your website visitors to take – whether they’re making a purchase, signing up for a newsletter, or filling out a contact form. They’re vital indicators of your website’s effectiveness in achieving its goals. The importance of conversion tracking is twofold. Firstly, it provides an insightful measure of the effectiveness of your pages, campaigns, and keywords. Secondly, and more critically, without conversion tracking, your decisions about where to invest time and resources could be based on incomplete data, leading to sub-optimal outcomes.
![]()
- Conversion Event Customization: Google Analytics 4 allows users to define custom conversion events that align with their unique business objectives.
- Conversion Paths: With the introduction of the new conversion paths feature, you can now visually trace the journey users take to complete a conversion.
In Google Analytics 4, setting up conversion tracking is a breeze. Navigate to the “Engagement” tab and click “Conversions” from there, where you can define and monitor your specific conversion actions, thus bridging the gap between raw data and meaningful insights.
Monitoring Bounce Rates
In the world of GA4, engagement is no longer a simple calculation of users entering and exiting a single page. Instead, it’s about understanding whether users genuinely interact with your website and find value in it, a significant reason why you should switch to GA4.
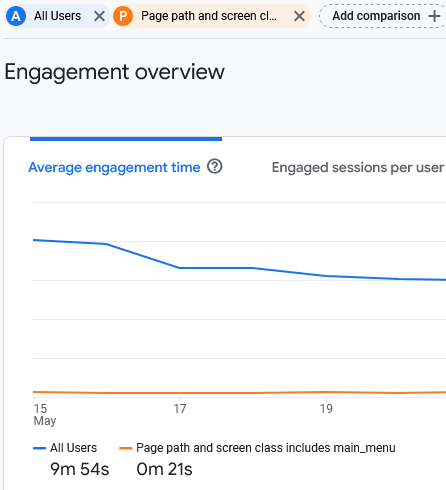
Engagement Rate Overview:
The engagement rate is one of the most fundamental metrics in GA4. It signifies the percentage of sessions that lasted 10 seconds or longer or had a conversion event or two or more page views.
How to Find and Interpret Engaged Sessions:
- Navigate to the ‘Engagement’ section: Begin by clicking the ‘Engagement’ tab on the left-hand side menu of your GA4 dashboard.
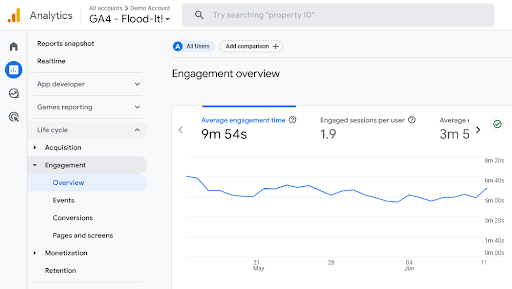
- Open ‘Overview’: You’ll find the ‘Overview’ within the’ Engagement’ section. Here, you will see the total number of engagement sessions, and you can compare it to the total number of sessions to get an idea of your engagement rate.
- View Detailed Engagement Metrics: Below the overview, you’ll find a graph that breaks down engagement into ‘Engaged Sessions per User,’ ‘Average Engagement Time,’ and ‘Average Engagement Time per Session,’ which gives you a more nuanced view of user engagement on your site.
- Breakdown by Page Title or Page Path: You can further dissect these engagement metrics by page title or page path. By clicking ‘Add Comparison’ and selecting ‘Page title’ or ‘Page path,’ you’ll see these metrics broken down by individual pages, which helps you identify which pages have low engagement rates and may need adjustments to improve user experience.
Using this approach, you’ll be better equipped to understand how users interact with your site and where improvements may be needed to increase engagement.
Utilizing Geo-Location Data
Understanding your audience’s geographical distribution provides you with opportunities to tailor your content and marketing strategy accordingly. If your visitors are spread globally, consider adding international-friendly features, such as multi-language options or region-specific content.
- Geo-Specific Metrics: Google Analytics 4 offers geo-specific metrics, providing a detailed overview of visitor behavior per location.
- Location-Based Reporting: With the location-based reporting feature, GA4 helps businesses deliver targeted content and advertising.
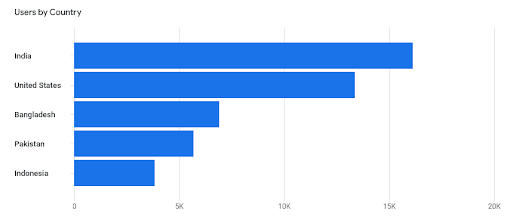
In Google Analytics 4, this data is conveniently located under “User Attributes > Demographic Details.” This feature provides a comprehensive view of where your traffic originates, empowering you to create a more personalized user experience.
Catering to Mobile Users
These days, a significant portion of internet traffic comes from mobile devices. As such, having a mobile-responsive website is no longer a luxury but a necessity. It’s crucial to ensure that your website provides an excellent user experience, irrespective of the device used to access it.
To gauge your website’s mobile-friendliness, Google Analytics 4 provides a comprehensive report under the “Tech > Overview” section. It lets you understand if your site delivers as expected for mobile users. Moreover, the “Tech Details” gives you a snapshot of the devices visitors use to browse your site, which helps you ensure that your website is optimized for the most popular devices amongst your audience.
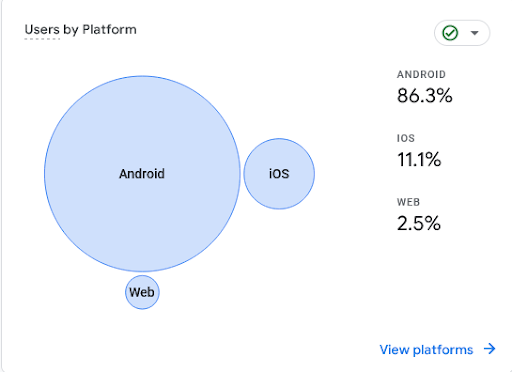
- Device Breakdown: With GA4, you can see a detailed breakdown of traffic by device type, including mobile, desktop, and tablet.
- Device-Specific Conversion: GA4 can show you how conversion rates differ by device, allowing for more targeted optimization strategies.
Evaluating Conversion Paths
Understanding your visitors’ journey before they convert is crucial in optimizing your marketing strategy and user experience. In GA4, the user journey is considered as the sequence of interactions a user makes on your website or app, including the events leading to a conversion. Conversions refer to the completion of an activity that is beneficial to your business, such as completing a lead form or making a purchase.
Accessing User Journey in GA4
- Navigate to ‘Explore’: Click on the ‘Explore’ tab in the left-hand side menu of your GA4 dashboard.
- Choose ‘Free Form’: Select ‘Free Form’ from the exploration templates. This template allows you to create custom charts and tables that give detailed user behavior insights.
- Set Up Your Exploration: Add the dimensions, metrics, and segments you want to analyze. You can choose to examine individual user journeys by selecting the “User ID” or “Device ID” dimensions. Include the “Event name” dimension to view each user’s specific interactions with your site.
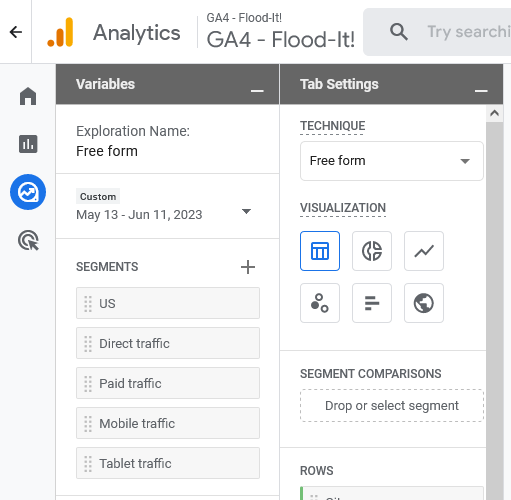
By using the “Free Form” exploration, you can create custom reports that provide a user-centric view of customer journeys, allowing you to understand better the actions and touchpoints that drive conversions. Understanding these can inform your strategy to improve user experience and boost conversion rates.
And for analyzing conversion paths specifically:
- Select ‘Path Exploration’: Select’ Path Exploration’ from the list of techniques. This template allows you to analyze user journeys with tree graphs.
- Configure Your Path Exploration: You’ll want to set the ‘Event name’ as the dimension for your path analysis and then set the starting and ending points for the user journeys you want to analyze. For instance, you might set the starting point as the ‘session_start’ event and the ending point as your conversion event (like ‘purchase’ or ‘lead_form_complete’).
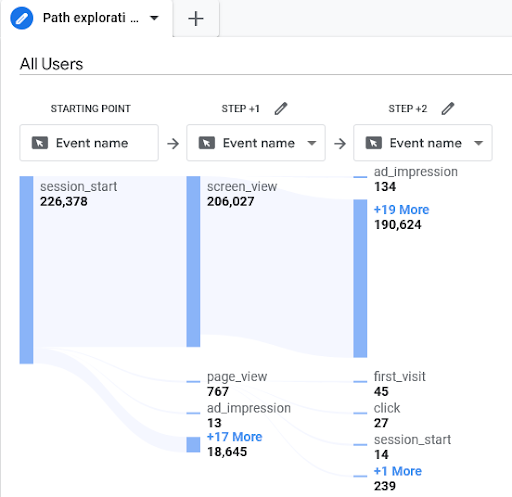
This way, you can visualize the sequence of events users typically take leading up to a conversion, helping you to identify the most common and effective paths to conversion on your website or app.
- Multi-Touch Attribution: GA4’s conversion paths support multi-touch attribution, enabling you to understand the role of each touchpoint in the conversion process.
- Path Length Report: The Path Length report in GA4 provides insights into the number of interactions it typically takes for a user to convert.
The purpose of evaluating conversion paths is to highlight the touchpoints influencing a visitor’s decision to convert, whether it’s a particular page, a promotional ad, or a specific piece of content.
Strategy Implementation
With this data in hand, the next step is forming a concrete SEO strategy, which should tie directly into your overall business goals, whether selling a particular product or building an email list. Google Analytics supports goal tracking, but the path from clicks to conversions requires a solid Google Analytics 4 setup. And that’s where we can lend a hand!
Let Oyova help you craft a digital marketing strategy and Google Analytics setup that aligns with your goals. We offer comprehensive SEO services with proven SEO results. Contact us to get the ball rolling today!
Related Posts
Browser Bookshop: How Niche Platforms Change Online Retail
Online retail has reached a turning point. Consumers no longer want endless choices, cluttered interfaces, or platforms that...
Read More
AI vs. Traditional Agencies: Which Delivers Better ROI for Your Business?
In today’s rapidly evolving digital landscape, businesses face a challenging decision: whether to stick with traditional marketing agencies...
Read More
Scaling Digital Marketing for Law Firms, Logistics, and Healthcare
Scaling digital marketing isn’t just about spending more on ads or publishing more blogs. It’s about building sustainable...
Read MoreOur Awards